San Leandro Police Department Data Deep Dive

Overview

In collaboration with the San Leandro Police Department (SLPD) and California Polytechnic State University’s (Cal Poly) Digital Transformation Hub (DxHub) powered by Amazon Web Services (AWS), three Cal Poly students used geospatial mapping, time series analysis and statistical methods to better understand crime patterns in the San Leandro, California area. Math majors Kirstie MacLeod, Emma Lang, and Madeline Bourquin worked closely with their mathematics professor Dr. Joyce Lin and SLPD Crime Analyst Denise Joseph to compile and analyze over 40,000 arrests between January 2012 and January 2019.

By examining these data sets, the team aimed to answer three questions:

  • Are the same types of crimes being committed by juveniles in high-density crime areas and low-density crime areas?
  • Are high-density juvenile crime areas disproportionately close to schools?
  • Are juvenile arrests near high schools related to month and time of day? Are juvenile and adult arrests following the same distribution by month and time of day?

Approach

The students used two tools to conduct their statistical analysis: RStudio and ArcGIS. RStudio was used to organize and sort data, clean up spelling errors, input latitudes and longitudes of crime locations, and correctly format penal codes, while ArcGIS was used to conduct geospatial mapping and heatmaps based on datasets documenting committed crimes.

Results

Question #1 – Are the same types of crime being committed by juveniles in high-density crime areas and low-density crime areas?

Findings – There are discrepancies in the types of crimes being committed by juveniles in high-density crime areas and low-density crime areas. Through examining 12 penal codes, ranging from trespassing and petty theft to robbery and burglary, among others, it was found that the greatest differences between high- and low-density crimes were petty theft (484 PCM) and trespassing (602 PCM), both of which occur disproportionately more often in high-density crime areas. (Figure 1).
Figure 1
Figure 1: The proportion of juvenile penal code violations in high- and low-density crime areas.

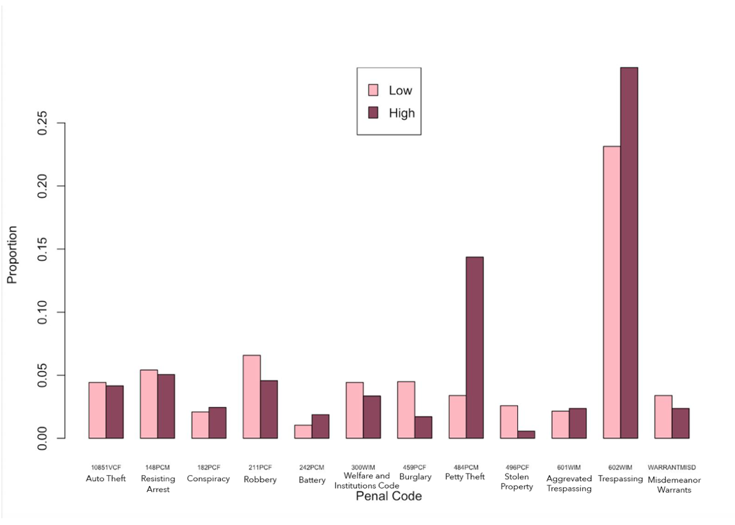
Question #2 – Are high-density juvenile crime areas disproportionately close to high schools?

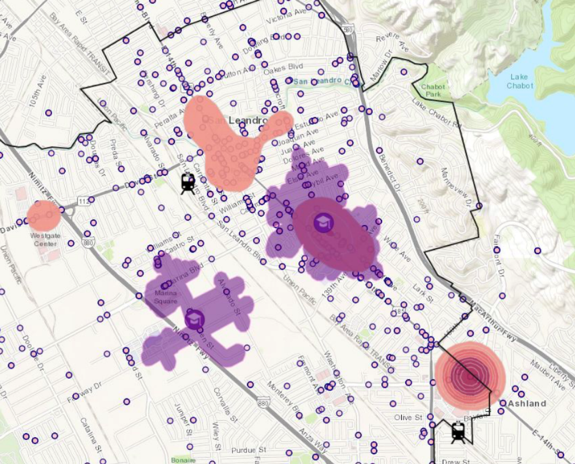
Findings – High-density juvenile crime areas account for 21% of the city but take up approximately 41% of the zones within a half mile radius from a school. When tested using statistical processes, it was found that high-density juvenile crime areas are disproportionately close to high schools. Research also indicates that less than 5% of the crimes are committed by juveniles under the age of 13. The team considered this research and using ArcGIS were able to further focus the scope of their analysis to crimes within a half mile walking distances from high schools. (Figures 2, 3, 4, 5).  Using this new scope, the students found that juvenile arrests are 2.7 times more likely to occur within this zone than outside of it.
Figure 2
Figure 2: ArcGIS heat map of walking routes within a half mile radius of San Leandro schools.
Figure 3
Figure 3: ArcGIS heat map of high density crime areas.
Figure 4

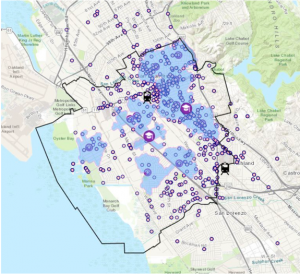
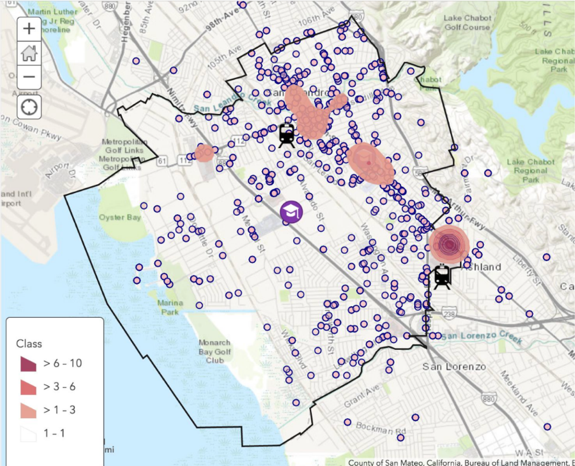
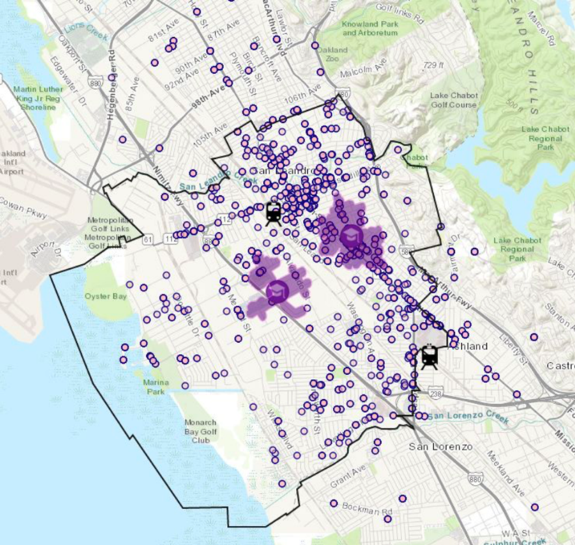
Figure 4: ArcGIS heat map of crimes that have occurred within a half mile radius from high schools.

Figure 5
Figure 5: Overlaying ArcGIS heat maps of Figure 3 high density crime areas (pink) and Figure 4 crimes that have occurred within a half mile radius from high schools (purple).

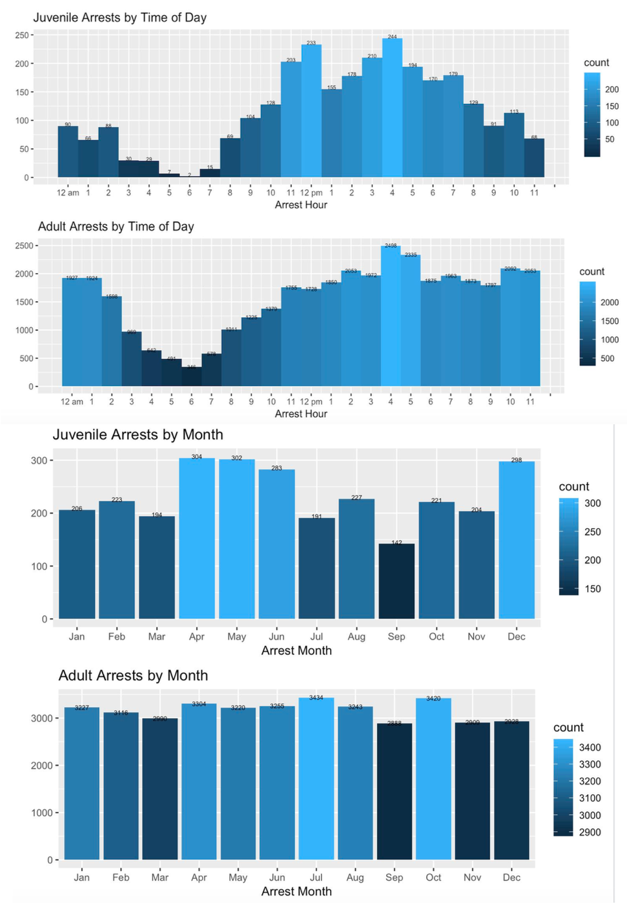
Question #3 – Are juvenile arrests near high schools related to month and time of day? Are juvenile and adult arrests following the same distribution by month and time of day?

Findings – Juvenile crime is higher during the school year (August-June) than during summer, with particularly high crime rates in April and September.  Juvenile arrests within a half a mile of a high school are 1.7 times more likely between 12:00-12:59 PM (during lunch), 2.1 times more likely between 3:00-3:59 PM (right after school), and 2.8 times less likely to occur between 8:00 PM-5:59 AM than they are if the crimes were committed further than a half a mile away from a high school. Both juvenile and adult arrests are less likely to occur in the early hours of the morning (between 3:00-7:59 AM), but adult arrests do not decrease during late night hours like juvenile arrests do. Juvenile arrests follow a more seasonal distribution than adult arrests, which tend to stay more constant throughout the year. Juvenile arrests are 1.37 times more likely to be during the school year than adult arrests, 1.43 times more likely to be during December, and 1.34 times more likely to occur in the spring (April-June). (Figure 6).
Figure 6
Figure 6: Variations in adult and juvenile arrests by month and time of day.

Conclusion

Upon the conclusion of their research, MacLeod, Lang and Bourquin presented their findings to SLPD analyst Denise Joseph. According to Joseph, MacLeod, Lang and Bourquin’s analysis of over 40,000 crimes will provide insightful information about the city’s crime patterns, and assist the department in finding more effective ways to delegate their resources in the future.  In addition to providing SLPD with pivotal information that can assist in lowering crime rates, Joseph believes that the research conducted by their team has greatly impacted her professional growth.

To read more about the SLPD Evidence-Based Policing project here.

About the DxHub

The Cal Poly Digital Transformation Hub (DxHub) is a strategic relationship with Amazon Web Services (AWS) and is the world’s first cloud innovation center supported by AWS on a University campus. The primary goal of the DxHub is to provide real-world problem-solving experiences to students by immersing them in the application of proven innovation methods in combination with the latest technologies to solve important challenges in the public sector. The challenges being addressed cover a wide variety of topics including homelessness, evidence-based policing, digital literacy, virtual cybersecurity laboratories and many others. The DxHub leverages the deep subject matter expertise of government, education and non-profit organizations to clearly understand the customers affected by public sector challenges and develops solutions that meet the customer needs.