
Exploring methods to improve Purchasing Power Parity (PPP) calculations for the World Bank’s International Comparison Program
Background
PPPs are used to make cross country comparisons of GDP, consumption, and investment and are published for all countries participating in the International Comparison Program at the level of GDP, and for 44 expenditure levels below GDP. PPPs are expressed using the United States dollar as the base currency and are freely accessible through the World Bank’s Databank.
ICP data encompass PPPs and price level indexes (the ratio of a country’s PPP to its market exchange rate), as well as PPP-adjusted expenditures in both aggregate and per capita form. Users of ICP data, and the cross-country comparisons that they enable, include policy makers, multilateral institutions, academia, the media, and the private sector. The breadth and depth of the ICP dataset make it a valuable input to a wide range of themes under the economic, environmental, and social development umbrellas. PPPs are used to establish the international poverty line and measures of global poverty and income inequality, which in turn are used by Sustainable Development Goals (SDGs) 1 and 10 to monitor progress. Other SDGs focusing on agriculture, health, education, labor, and energy and emissions also draw on PPPs to track progress. ICP data are also used in the UN’s Human Development Index and the World Economic Forum’s Global Competitiveness Index. Analyses of economic growth, productivity, trade, government expenditure, investment, health costs, migration, waste, welfare, prices, and the impact of violence are other examples.
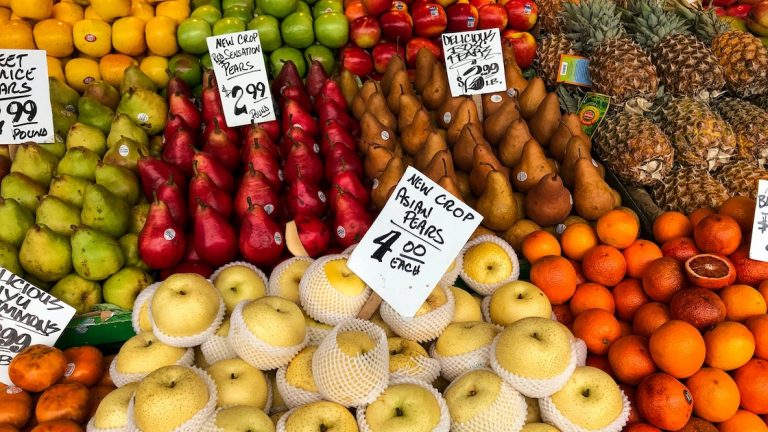
In order to calculate PPPs, the ICP collects price data for items or products selected as part of the “basket of goods and services” that are both nationally relevant and representative of expenditures within GDP as well as largely comparable within and across regions. Surveys are carried out for household consumption products, for construction and civil engineering, for machinery and equipment, and for Government consumption. Of these, the household consumption survey covers the largest expenditure share, accounting for more than 60 percent of GDP in the majority of countries. ICP collects prices for a wide range of goods and services that are consumed by households such as food, beverages, tobacco, clothing, footwear, utilities, furniture, household appliances, pharmaceuticals, private health care services, motor vehicles, transportation services, electronic equipment, communication services, catering services, accommodation services, recreational activities, personal hygiene, and other goods and services.
The Program also collects data on expenditures through national accounts, as well as data on population size and prevailing market exchange rates, and metadata. To achieve this huge data collection exercise, the ICP relies on a global partnership of international, regional, sub-regional, and national agencies working under a global governance framework and to common standards and methodology.
Overview
Problem and Opportunity
Furthermore, collecting online product and price data to create an informal PPP estimate requires researchers to collect manually, store, and compare ‘like-with-like’ products, or items, mainly using spreadsheets. Augmenting and partially automating this manual approach to using data from online sources can provide ICP teams with a cost-effective way of developing near- real-time PPP estimates. In addition, having such an informal estimate will enable the teams to identify price and product trends while bridging the time gap between manual estimates.
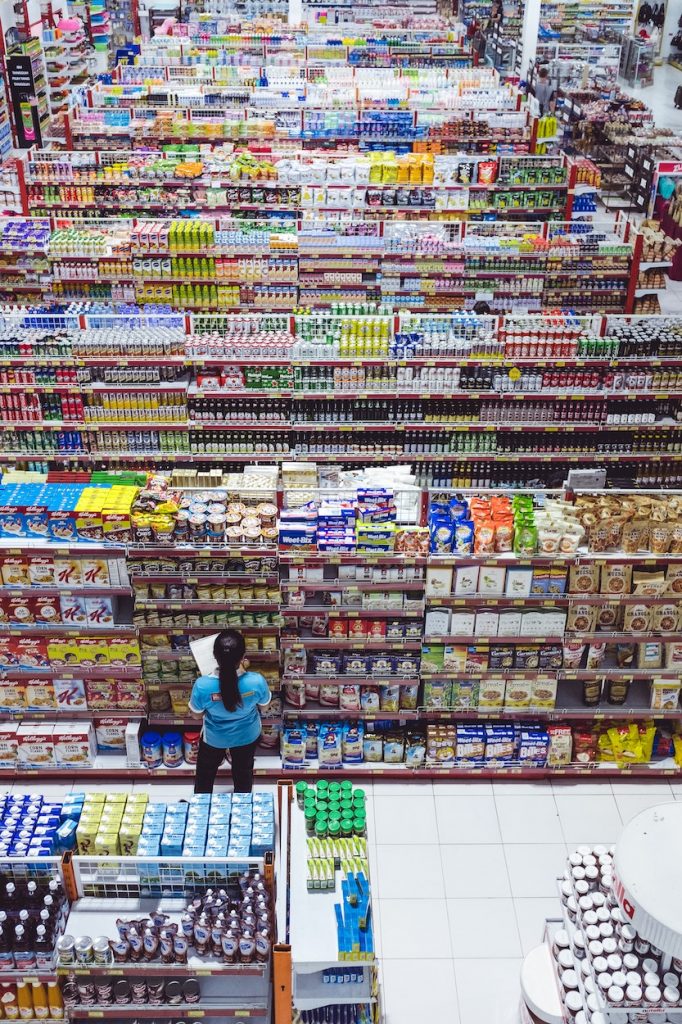
Once data have been collected, an ICP analyst must ensure that two separately collected products are comparable before the prices can be compared. Take beef, for example. A PPP estimate aims to compare the price of beef products that are comparable to each other, but are sourced in two different locations (e.g., United States vs. South Africa) – providing a spatial price comparison. Beef can be sold with different attributes such as ‘grade’ (prime, choice), ‘cut’ (ribeye, chuck roast, ground), and quantity (two 10oz steaks are not the same as one 20oz), to name but a few. Each product listed in an online source typically has similar data attributes; however, these may not be the same attributes for a similar product listed in a different country from a different online source. Accurately comparing these products at the scale necessary to create PPP estimates quickly becomes too labor-intensive and cost-prohibitive to be feasible.
Innovation in Action
To simulate data collection at scale, students collected product information including all attributes and prices from online sources using a python algorithm that stored samples of product data using AWS DynamoDB. Once the data were stored, the next phase of the solution was to extract meaningful parts of the sample data that would be useful for product matching. Product descriptions such as “All Natural* 73% Lean/27% Fat Lean Ground Beef” aren’t found under the same headings in data from one retailer to another. The team leveraged natural language processing (NLP) via deep learning and the Spacy.io Python library to solve this. Given only a few synonyms for a product attribute, the Spacy algorithm extracted the relevant values even if keys were named entirely different from data source to data source. For example, it recognized that the product description, e.g., Fat Lean Ground Beef was under the ‘title’ key from one online data source. In contrast, from another source, it recognized the project title from the ‘name’ key.
Matching products with varying descriptions is a difficult task to automate. So, the team first attempted to sort products into smaller subcategories and began using NLP to predict categories from descriptions. For example, the model correctly identified that “all natural* 96% lean/4% fat extra lean ground beef” was a description for ground beef.
The team supplemented the NLP capability with a ‘bag-of-words’ approach to categorization. ‘Bag of words’ is a common natural language processing strategy that extracts value from pieces of text by counting how many times each word appears in a particular description. Common words must be important. Data from online sources were often grouped by product. So, the team hypothesized that insight into individual categories could be gleaned from word groupings. This was a useful strategy in determining that a list of many descriptions, all of which related to a general category, served as an effective large grain filter to sort products with. While the ability to match ‘like-with-like’ products wasn’t easily accomplished, the team continues to pursue inferring additional attributes to match so as to further improve the product comparison.
Despite accurately categorizing products, it became apparent that matching products with high precision was too difficult a task to automate without a larger dataset to train on fully. This problem has only been solved by a single retailer with access to millions of products, so the World Bank and DxHub teams agreed to pivot to a hybrid solution. Instead of fully automating the matching process, they agreed to combine the success of categorizing and extracting data to augment a human’s ability to match products in similar categories easily. The team developed a web application using React, AWS API Gateway, and AWS Lambda that offers products from different categories that the algorithm believes are similar. The researcher confirms or corrects the product matching suggestion resulting in a running PPP estimate for that product. It is envisioned that online retailers can provide confidential and secure bulk data access of online product data through APIs (application programming interface) to this application to enable near real-time PPP estimates.

Conclusion
Supporting Documents
| Fictitious Press Release | During the Innovation Workshop, a fictional Press Release and nonfictional Frequently Asked Questions are drafted. This is a tool that is used to define the solution and why it matters to the customer. |
| Source Code | All of the code and assets developed during the course of creating the prototype. |
| GSE 580 Student Paper | Student project coauthored by students in GSE 580, Seminar in Economics, Spring 2021. Student participants include Brendan Hoang, Ian Donovan, Trevor Luenser, and Russell McIntosh. |
| GSB Student Project Group 1 | Student project coauthored by students in GSB 503, Collaborative Industry Project, Winter 2022. Student participants include Camille Postaer, Laxus Nikolaev, Joey Secard, and Addie Hermstad. |
| GSB Student Project Group 2 | Student project coauthored by students in GSB 503, Collaborative Industry Project, Winter 2022. Student participants include Mayank Loyalka, Preet Oza, Adhyatma Gautam, and Tzuchi Chiu. |
| GSB Student Project Group 3 | Student project coauthored by students in GSB 503, Collaborative Industry Project, Winter 2022. Student participants include Nick Bias, Will Gushurst, Nolan Neel, and Joseph Willemsz. |
| GSB Student Project Group 4 | Student project coauthored by students in GSB 503, Collaborative Industry Project, Winter 2022. Student participants include Vance Armstrong, Jack Ribarich, and Jack Rocca. |
| Architecture Diagram | A diagram that describes the technical components needed to implement the solution. |